MetricsQL学习笔记
快速开始
使用golang prometheus SDK库创建一个客户端
package main

import (
	"context"
	"fmt"
	"time"

	"github.com/prometheus/client_golang/api"
	v1 "github.com/prometheus/client_golang/api/prometheus/v1"
	"github.com/prometheus/common/model"
)

func main() {
	// 1. 创建客户端配置(VM 默认端口 8428)
	client, err := api.NewClient(api.Config{
		Address: "http://localhost:8428",
	})
	if err != nil {
		panic(err)
	}

	v1api := v1.NewAPI(client)
	ctx, cancel := context.WithTimeout(context.Background(), 10*time.Second)
	defer cancel()

	// 2. 执行 MetricsQL 查询 (即 Prometheus 瞬时查询)
	query := "up{job='node-exporter'}"
	result, warnings, err := v1api.Query(ctx, query, time.Now())

	if err != nil {
		fmt.Printf("查询出错: %v\n", err)
		return
	}
	if len(warnings) > 0 {
		fmt.Printf("警告: %v\n", warnings)
	}

	// 3. 处理结果
	switch v := result.(type) {
	case model.Vector:
		for _, sample := range v {
			fmt.Printf("指标: %s, 值: %v, 时间: %v\n",
				sample.Metric, sample.Value, sample.Timestamp)
		}
	}
}
语法、操作符与示例
基本语法
查询时间序列数据 (指标选择器)
返回所有以node_network_receive_bytes_total命名的时间序列数据
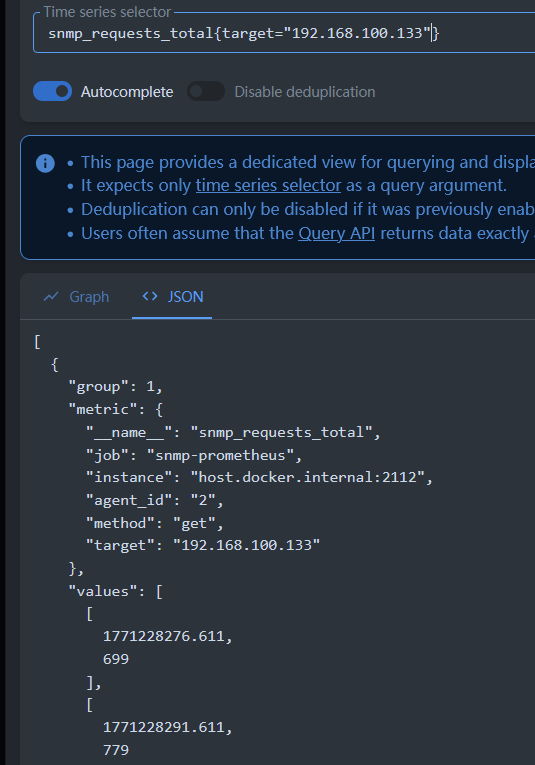
node_network_receive_bytes_total演示:查询snmp_requests_total时间序列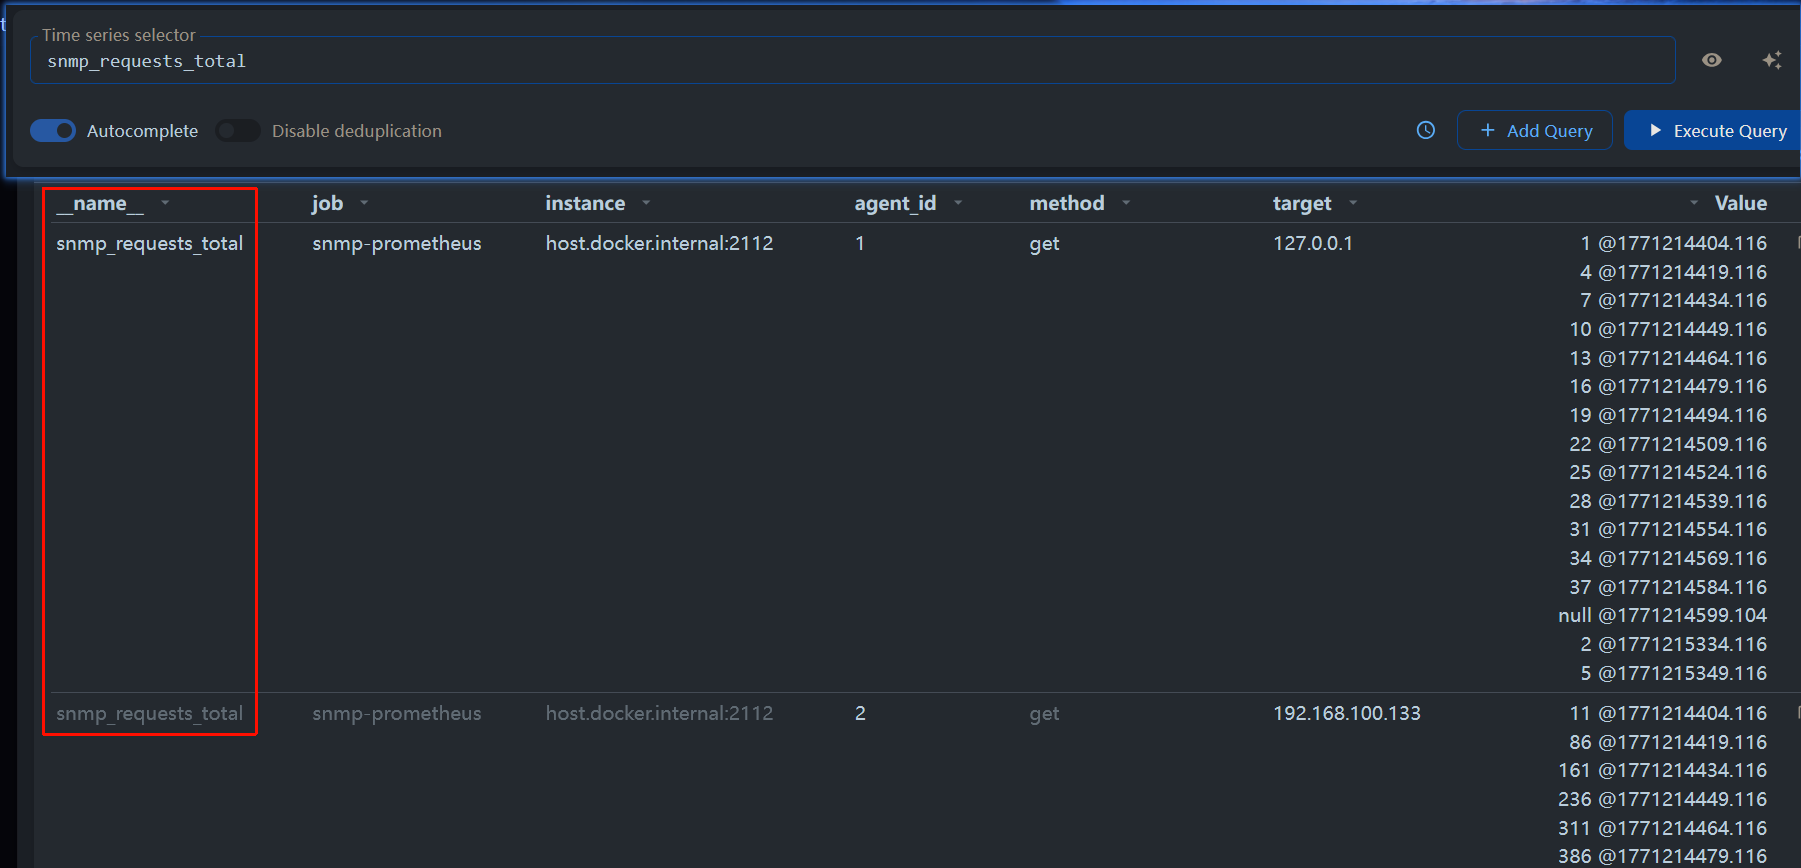
过滤标签名
查询带有eth1标签名的时间序列:
node_network_receive_bytes_total{device="eth1"}=(等于)!=(不等于)=~(正则匹配)
示例:node_network_receive_bytes_total{device=~"eth1|eth2"}node_network_receive_bytes_total{device=~"eth.+"}(过滤包含以eth开头的device标签的时间序列数据)
语法参见RE2文档
!~(正则排除)
过滤多个标签名
只在instance为node42:9100的Time Series上查询以eth开头的网络接口数据:
node_network_receive_bytes_total{instance="node42:9100", device=~"eth.+"}上述过滤条件被视为and与条件;PromQL不支持or或条件,但大多数时候都可以用正则表达式来模拟类似的效果:比如要过滤eth1和lo的数据
node_network_receive_bytes_total{device=~"eth1|lo"}正则匹配指标名
node_network_receive_bytes_total{__name__=~"node_network_(receive|transmit)_bytes_total"}数据分析
比对当前数据与历史数据
offset xxx:查询指定时间之前的数据
node_network_receive_bytes_total offset 7d返回一周以前的数据
示例:查询当前GC占用是一小时前GC占用的1.5倍的部分:
go_memstats_gc_cpu_fraction > 1.5 * (go_memstats_gc_cpu_fraction offset 1h)计算斜率
计算近5分钟内node_network_receive_bytes_total指标的斜率:
rate(node_network_receive_bytes_total[5m])计算前: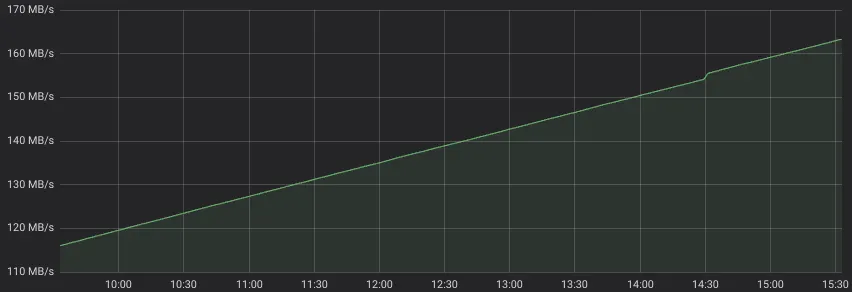
计算后: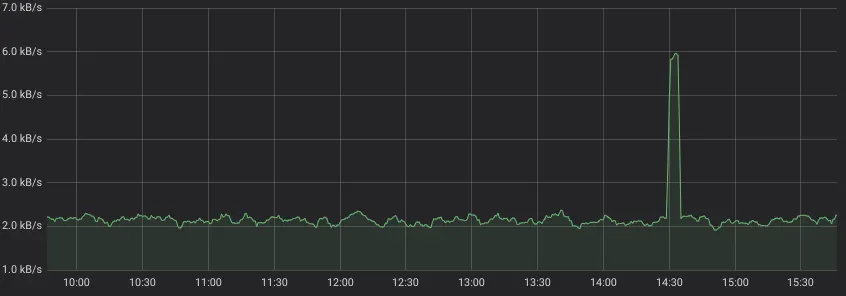
注意事项
Rate strips metric name while leaving all the labels for the inner time series.
Do not apply
rateto time series, which may go up and down. Such time series are called Gauges.Ratemust be applied only to Counters, which always go up, but sometimes may be reset to zero (for instance, on service restart).Do not use
irateinstead ofrate, since it doesn’t capture spikes and it isn’t much faster than therate.
算术操作符
PromQL支持所有基础算术操作符:
+-*:乘法/:除法%:求模^:指数运算
布尔运算符
PromQL支持下列布尔运算符:
==!=>和>=<和<=
组件函数
聚合与分组函数
PromQL allows aggregating and grouping time series. Time series are grouped by the given set of labels and then the given aggregation function is applied for each group. For instance, the following query would return summary ingress traffic across all the network interfaces grouped by instances (nodes with installed node_exporter):
sum(rate(node_network_receive_bytes_total[5m])) by (instance)仪表盘(Gauge)函数
Gauges are time series that may go up and down at any time. For instance, memory usage, temperature or pressure. When drawing graphs for gauges it is expected to see min, max, avg and/or quantile values for each point on the graph. PromQL allows doing this with the following functions:
For example, the following query would graph minimum value for free memory for each point on the graph:
min_over_time(node_memory_MemFree_bytes[5m])VictoriaMetrics adds rollup_*functions to PromQL, which automatically return min, max and avg value when applied to Gagues. For instance:
rollup(node_memory_MemFree_bytes)操作Labels
PromQL provides two functions for labels’ modification, prettifying, deletion or creation:
Though these functions are awkward to use, they allow powerful dynamic manipulations for labels on the selected time series. The primary use case for label_ functions is converting labels to the desired view.
VictoriaMetrics extends these functions with more convenient label manipulation functions:
label_set— sets additional labels to time serieslabel_del— deletes the given labels from time serieslabel_keep— deletes all the labels from time series except the given labelslabel_copy— copies label values to another labelslabel_move— renames labelslabel_transform— replaces all the substrings matching the given regex to template replacementlabel_value— returns numeric value from the given label
一次查询,多个返回值
Sometimes it is necessary to return multiple results from a single PromQL query. This may be achieved with [or](https://prometheus.io/docs/prometheus/latest/querying/operators/#logical-set-binary-operators) operator. For instance, the following query would return all the time series with names metric1, metric2 and metric3:
metric1 or metric2 or metric3VictoriaMetrics simplifies returning multiple results — just enumerate them inside ():
(metric1, metric2, metric3)Note that arbitrary PromQL expressions may be put instead of metric names there.
There is a common trap when combining expression results: results with duplicate set of labels are skipped. For instance, the following query would skip sum(b), since both sum(a) and sum(b) have identical label set — they have no labels at all:
sum(a) or sum(b)