
GC之外:揭开并修复Go最常见的四个内存泄露噩梦
重要
原作者:Puneet
原作者的博客主页:[https://medium.com/@puneetpm?source=post_page---byline--f87a7a678086---------------------------------------](Medium - puneet)
原文标题:Beyond GC: Unmasking & Fixing the 4 Most Common Golang Memory Leak Nightmares 👻
原文链接:https://osintteam.blog/automate-your-boring-stuff-with-python-a-practical-guide-for-everyday-cybersecurity-tasks-b78a266a98a7
备注
- 原文为Member Only会员阅读
版权完全由原作者所有。本页面为静态页面,不会统计浏览次数。
You know that feeling, right? You’re looking at your Go app’s memory charts, and they’re just… creeping up. Slowly, steadily. Every day, a little higher. You start to wonder if your perfectly crafted Go service is secretly turning into a bit of a memory monster. Trust me, you’re absolutely not alone in this boat. We’ve all been there, scratching our heads, thinking, “But Go has a garbage collector! Isn’t it supposed to handle this stuff for me?” Well, yeah, kind of. The thing is, Go’s GC is brilliant at cleaning up memory that’s unreachable. But if your code, by accident, keeps holding onto references, then, well, the GC can’t really do its magic, and poof — you’ve got yourself a sneaky little leak.
你一定感受过这种滋味,对吧?看着Go程序内存图表偷偷地、慢慢地、一点点地变高。你开始思考你那匠心开发的Go服务是不是在变成一头吞噬内存的怪物,相信我,你绝不是一个人。我们都有过抓耳挠腮的经历,我们会沮丧:“我Chovy Go GC给我把事干好了呀。”额,好吧,大概吧。事实是Go GC十分擅长清理 不可达的 内存,但如果你不小心在某个地方引用了本应该被清理的垃圾,那GC可就没法施展它的魔法了,然后就噗叽啪(指被狡猾的内存泄漏漏洞缠上)了
not alone in the boat
- in the same boat
(某人)和他人分享同样的、大多是困难的情况或境地
These aren’t usually those “BOOM, your app crashed immediately!” kind of problems. Nope. These are your silent killers. They just slowly eat away at your performance, boost your cloud bills (ugh, who needs that?), and then, eventually, you get that dreaded Out-Of-Memory (OOM) error. And guess what? Those almost always hit at, like, 3 AM. Total nightmare, especially when you’re running high-traffic services in production. The really cool thing, though? Go keeps getting better. With the recent Go 1.26 release back in February 2026, our tools for sniffing out these issues have gotten super sharp.
内存泄漏通常不会让程序瞬间爆炸。它当然没这么厉害,但仍然会慢慢杀死程序可用性。
So, here’s the deal: in this article, we’re gonna peek behind the curtain at four of the most common ways your Go apps might be leaking memory. We’ll chat about the problem itself, what signs to look for (you know, the symptoms), how to diagnose it using awesome tools like pprof (it's a lifesaver, honestly), and then, of course, the solutions to get that memory back and finally sleep through the night. Let's dive in, shall we? Time to turn those memory leak worries into sweet dreams of super-efficient Go applications! ✨
1. The Phantom Goroutines: When Concurrency Becomes a Liability 👻
Ah, goroutines. They’re like Go’s special superpower, right? Makes building fast, scalable stuff feel almost easy. But, and this is a big “but,” with great power comes, well, great responsibility. And, honestly, goroutines that aren’t managed well? They’re probably the number one reason I see for memory leaks in Go. Total head-scratcher sometimes!
Issue: Goroutine Leaks
So, what’s a goroutine leak? Basically, it happens when you kick off a goroutine, but it just never, ever finishes its job. Maybe it got stuck waiting for something that’ll never come, or maybe it just didn’t get the memo to stop. When that happens, its stack memory and anything it’s holding onto just stays allocated. Forever. Even if what it was supposed to do is now totally pointless. Over time, these forgotten goroutines just pile up, like digital dust bunnies, slowly but surely gobbling up your app’s precious memory.
Symptoms:
- Memory Usage Just Climbs and Climbs: You’re looking at your metrics, and your RAM footprint is going up like a rocket, even if your app isn’t really doing more work. Annoying, isn’t it?
- Everything Slows Down: With a bazillion goroutines running, Go’s scheduler has to work overtime. That means more CPU use and your app responding slower. Not ideal for users!
- “Too Many Goroutines” Messages: In really bad cases, the Go runtime itself might complain that there are just too many of these little guys running around.
- OOM Errors: Yep, the big one. Eventually, your system just says, “Nope, no more memory for you!” and kills your process. Happens.
Diagnosis:
Here’s where the Go toolchain truly shines, especially with pprof. It's like having x-ray vision for your code!
- Get
pprofReady: First things first, you need to expose thenet/http/pprofendpoints in your application. Super easy, just import it.
package main
import (
"log"
"net/http"
_ "net/http/pprof" // Yep, just this simple import does it
)
func main() {
// I always recommend putting pprof on its own dedicated port, especially in production.
// Safety first, you know? Don't want just anyone poking at your profiles.
go func() {
log.Println(http.ListenAndServe("localhost:6060", nil))
}()
// Your main app logic goes here
select {} // Just keeping the main goroutine alive for this example
}
- A little side note: Seriously, in a real production setup, secure that
_pprof_port! Localhost or behind a proper auth layer is the way to go. You wouldn't leave your house door unlocked, would you? - Grab a Goroutine Profile: While your app is doing its thing (and maybe leaking), you can use
go tool pprofto snag a profile.
- The Usual Suspects Profile: This one shows you all the active goroutines.
go tool pprof http://localhost:6060/debug/pprof/goroutine
- The Super Cool
goroutineleakProfile (Go 1.26+): Okay, this is where it gets really exciting! Go 1.26, which dropped earlier this year (February 2026, to be precise), brought us this experimentalgoroutineleakprofile. It's built specifically to find those goroutines stuck indefinitely, usually on some concurrency primitive that's just never going to get unstuck. To use it, you gotta tell Go about the experiment when you build:
GOEXPERIMENT=goroutineleakprofile go build -o myapp .
Then, once your app is running:
go tool pprof http://localhost:6060/debug/pprof/goroutineleak
- Honestly, this experimental feature is such a game-changer for finding these tricky leaks. I hear whispers that it might even become the default in Go 1.27. Pretty awesome, right?
Read the Tea Leaves (or, you know, the Output):
- Once you’re in the
pprofshell, typetop. This shows you which functions have the most goroutines hanging around. - Then,
list FunctionNamelets you zoom right into the code causing the trouble. - And for the visual learners out there,
webpops open a browser with an SVG graph. It's usually super clear where things are getting stuck. Plus, with Go 1.26, thepprofweb UI often defaults to that lovely flame graph view, which is just fantastic for visual debugging!
- You’re looking for goroutines that are just chilling in operations that really shouldn’t take forever, like
select {}, waiting on channels (<-chan), or network calls that forgot their timeouts. If you're using that cool newgoroutineleakprofile, it'll even add a helpful(leaked)tag, which is, like, a huge clue!
Solution:
The big secret here? Make sure every goroutine has a clear, planned way to exit. No stragglers!
- Context for Cancellation: This is your best friend. Use
context.Contextto send a "time to go!" signal to your goroutines. Just pass acontext.Contextinto your functions that start goroutines and tell them to listen forctx.Done().
package main
import (
"context"
"fmt"
"time"
)
func managedWorker(ctx context.Context, id int) {
for {
select {
case <-ctx.Done():
fmt.Printf("Worker %d: Context cancelled, exiting. Bye!\n", id)
return
default:
// Just pretending to do some hard work
fmt.Printf("Worker %d: Still chugging along...\n", id)
time.Sleep(500 * time.Millisecond)
}
}
}
func main() {
parentCtx, cancel := context.WithCancel(context.Background())
for i := 0; i < 3; i++ {
    go managedWorker(parentCtx, i)
}

// Let our little workers run for a bit
time.Sleep(2 * time.Second)

// Okay, time to send the "stop" signal!
cancel()
fmt.Println("Cancellation signal sent. Hopefully, they heard me!")

// Give them a moment to actually exit gracefully
time.Sleep(1 * time.Second)
fmt.Println("Main application exiting. Phew, that was close!")
}
- Make Sure Channels Don’t Get Stuck: If you’re using channels to talk between goroutines, you have to make sure that everyone sending and receiving has a way to unblock or, you know, just close the channels when they’re done. Unbuffered channels, in particular, are notorious for causing deadlocks and leaky goroutines if you’re not super careful.
- Be Smart with
sync.WaitGroup: When you're usingsync.WaitGroupto wait for goroutines to finish, always, always callwg.Add()before you launch those goroutines. Otherwise, you might run into a weird race condition wherewg.Wait()thinks everything's done too soon. I've seen that trip people up more than once!
2. The Expanding Universe: Unbounded Data Structures 🌌
Press enter or click to view image in full size
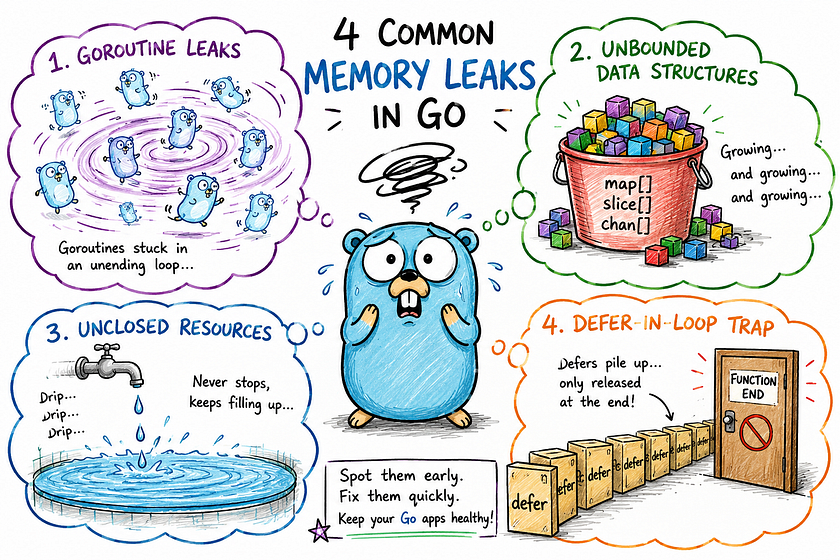
Go Memory Leaks: 4 Silent Killers Every Gopher Should Know 🐹💧
Sometimes, the simplest things are the ones that give you the biggest headaches. I’m talking about when you just let your data structures, like slices and maps, grow and grow and grow, without any kind of plan to, like, remove old stuff. It’s a classic!
Issue: Unbounded Growth in Slices and Maps
Imagine you’re building something that needs to hold temporary data — maybe a cache, a place to buffer logs, or a list of active user sessions, and you’re using a map or a slice for it. If you just keep adding things to it without ever taking anything out, that structure is gonna keep eating up more and more memory. It'll just hold onto all those old references, even if you don't really need that data anymore. Total memory hog!
Symptoms:
- Slow, Steady Memory Creep: Similar to the goroutine issue, but this one usually feels a bit slower, and you can often link it directly to how much data your app is processing or storing.
- App Feels Sluggish: When your data structures get massive, your garbage collector has more work to do, and finding stuff in those huge maps or slices just takes longer. Everything feels a bit sticky.
- OOM Errors (Again!): Yep, if your heap just keeps filling up, eventually the system throws in the towel.
Diagnosis:
Here, pprof's heap profile is basically your superpower.
Grab a Heap Profile:
go tool pprof http://localhost:6060/debug/pprof/heap
Dig Into the Profile:
- Type
topto see which functions are, shall we say, "most enthusiastic" about allocating memory. list FunctionNameis your direct line to the problematic code.- You’re basically looking for huge
maps orslices that are just ballooning in size. You might see calls toruntime.growsliceorruntime.mapassignpopping up a lot. - The
alloc_spaceandinuse_spacenumbers are super helpful here. They tell you how much memory is being grabbed and how much is actively being used. I always try to compare profiles over time - that's the real trick to seeing a slow leak.
Solution:
It really comes down to having a clear plan for your data’s entire life cycle.
- Smart Caching with Eviction Policies: If you’re building a cache, please use one with smart eviction rules. Think LRU (Least Recently Used) or LFU (Least Frequently Used). Don’t try to roll your own unless you really, really know what you’re doing — libraries like
hashicorp/golang-lruare your friends here! - Keep Your Collections Bounded: If you’re using slices as buffers, make sure they have a maximum size. Kick out the old stuff, or just overwrite it. Simple as that.
- Let Go of References: When you’re done with a map or a slice, setting it to
nilis a great way to tell the GC, "Hey, you can have this back now!" For maps,delete(m, key)or just making a brand-new map (m = make(map[K]V)) works. With slices, if you reslice it to a smaller size or create a whole new one, that can actually free up the underlying array if nothing else is still pointing to the bigger, older version.
package main
import (
"fmt"
"time"
)
// Oh no, a leaky cache!
var leakyCache = make(map[int][]byte)
func addToLeakyCache(id int, data []byte) {
leakyCache[id] = data // No rules, just adds forever
}
// Okay, a much better (though still simple) bounded cache
const maxCacheSize = 5 // We'll keep it small for this example
var boundedCache = make(map[int][]byte)
var cacheKeys []int // Gotta track insertion order for our basic eviction
func addToBoundedCache(id int, data []byte) {
if _, exists := boundedCache[id]; exists {
// If it's already in there, we update it and move it to the "most recent" spot
for i, key := range cacheKeys {
if key == id {
cacheKeys = append(cacheKeys[:i], cacheKeys[i+1:]...) // This is how you remove from a slice, btw!
break
}
}
} else if len(cacheKeys) >= maxCacheSize {
// Time to kick out the oldest entry!
delete(boundedCache, cacheKeys[0])
cacheKeys = cacheKeys[1:] // Shift everyone over
}
boundedCache[id] = data
cacheKeys = append(cacheKeys, id)
}
func main() {
fmt.Println("--- Simulating Leaky Cache ---")
for i := 0; i < 10; i++ {
addToLeakyCache(i, make([]byte, 1024*1024)) // Adding 1MB each time, yikes!
fmt.Printf("Leaky cache size: %d entries, roughly %d MB. See it grow?\n", len(leakyCache), len(leakyCache))
// In a real app, you'd see memory usage just keep climbing here. Not good!
}
fmt.Println("\n--- Simulating Bounded Cache ---")
for i := 0; i < 10; i++ {
    addToBoundedCache(i, make([]byte, 1024*1024))
    fmt.Printf("Bounded cache size: %d entries, roughly %d MB. See how it stabilizes? Nice!\n", len(boundedCache), len(boundedCache))
    // Here, the memory for the cache itself should chill out around maxCacheSize * 1MB. Much better.
}

// Just letting the app run a bit longer so you could *theoretically* observe GC
time.Sleep(5 * time.Second)
fmt.Println("Application finished. Hope this helped!")
}
3. The Forgotten Closures: Unclosed Resources 🗑️
Go is pretty big on making you manage your resources explicitly, and for good reason! But, gosh, it’s unbelievably easy to just forget to Close() things like HTTP response bodies, files you've opened, or database connections. And no, this isn't just about hitting system limits, like "too many open files." It's actually a super common way to leak memory, because all those underlying buffers and connections just stay open, eating up resources in your app.
Issue: Unclosed Resources
When you do stuff like http.Get(), or os.Open() a file, or even run a query on your database, these operations often give you back things that must be explicitly closed. If you totally forget to call that all-important Close() method, then the memory and system handles tied to those resources never get released. And guess what? They build up. Over time.
Symptoms:
- Memory Footprint Going Up: Yeah, same story as the other leaks — memory just keeps climbing.
- “Resource Exhaustion” Errors: This is a big red flag. You’ll start seeing errors like “too many open files” or “connection refused.” That’s your operating system screaming that your app is hogging all the good stuff.
- Network Socket Leaks: For HTTP connections, your system might just keep those network sockets open, which is another resource drain.
Diagnosis:
This one usually needs a mix of pprof heap profiles and some good old-fashioned code detective work.
- Heap Profiles: A heap profile can sometimes point you in the right direction. You might see a bunch of memory allocations hanging around from
net/http,os, or even your specific database driver packages, suggesting someone forgot to callClose()on those things. - Code Review: Honestly, a careful code review is often the quickest win here. Just scan your code for
http.Response.Body,os.File,sql.Rows,sql.Conn, and similar types. Then, immediately check if there's adefer .Close()right after they're created. Also, big shout-out to static analysis tools likegolangci-lintwith itsbodycloseandsqlclosechecklinters - they can totally automate finding these common mistakes for you!
Solution:
My advice? Embrace defer like it's the coolest thing ever (because it kind of is!).
- Always
defer .Close(): For any resource that needs to be closed, just put adefercall to itsClose()method immediately after you create it. Seriously, make it a habit! This way, the resource gets closed automatically when the function finishes, no matter what happens - even if there's an error. Super handy, saves so much grief.
package main
import (
"fmt"
"io"
"log"
"net/http"
"os"
)
func fetchData(url string) ([]byte, error) {
resp, err := http.Get(url)
if err != nil {
return nil, fmt.Errorf("oops, couldn't make that HTTP request: %w", err)
}
defer resp.Body.Close() // 👈 See? Always defer Close()! It's like magic.
data, err := io.ReadAll(resp.Body)
if err != nil {
    return nil, fmt.Errorf("darn, couldn't read the response body: %w", err)
}
return data, nil
}
func processFile(filename string) error {
file, err := os.Open(filename)
if err != nil {
return fmt.Errorf("uh oh, couldn't open file: %w", err)
}
defer file.Close() // 👈 And here too! Defer is your best friend.
// Just pretending to read the file here
content, err := io.ReadAll(file)
if err != nil {
    return fmt.Errorf("failed to read file content, darn it: %w", err)
}
fmt.Printf("Processed file: %s, with content length: %d bytes. Looks good!\n", filename, len(content))
return nil
}
func main() {
// Let's try fetching some data!
data, err := fetchData("https://www.example.com")
if err != nil {
log.Printf("Bummer, error fetching data: %v\n", err)
} else {
fmt.Printf("Woohoo! Fetched %d bytes from example.com.\n", len(data))
}
// Now, let's play with a file
// Gotta make a dummy file first, right?
dummyFile, _ := os.Create("test.txt")
dummyFile.WriteString("Hello Go! This is some test content.")
dummyFile.Close() // Important to close this too, even after writing!

err = processFile("test.txt")
if err != nil {
    log.Printf("Ugh, error processing file: %v\n", err)
}

// Clean up our mess! Good habits, you know.
os.Remove("test.txt")
}
4. The defer Trap: Loops and Late Releases 🔄
Okay, so we just talked about how defer is awesome for managing resources, right? But ironically, if you use it in the wrong way inside loops, it can actually cause a different kind of memory problem. This one's a bit sneaky, and it catches a lot of folks off guard.
Issue: defer in Loops
Here’s the deal: a defer statement basically tells Go, "Hey, run this function call just before the current function exits." So, if you drop a defer inside a loop that's going to run a whole bunch of times, all those deferred calls (and any resources or variables they've captured) just pile up on a special stack. They stay there until the outer function finally finishes. If that loop is, like, super long, you're gonna see some serious, though temporary, memory spikes. It's like going to the grocery store and putting everything you buy in a separate basket, then realizing you have to carry all those baskets out at once instead of putting them in one big cart.
Symptoms:
- Memory Goes Wild, Then Drops: You’ll see your memory usage jump way up while a big loop is running, and then it suddenly goes back down once that function is done. It’s like a rollercoaster, but for your RAM!
- App Feels Slower (Again): All those deferred calls piling up can add extra overhead, making things a bit sluggish.
- Resource Limits: Just like with unclosed resources, you might hit limits if too many file descriptors or connections are sitting there, waiting for the
deferto finally run.
Diagnosis:
- Heap Profiles (Mid-Loop!): If you grab a heap profile while that problematic loop is chugging along, you might just spot a surprising amount of memory being held by temporary objects that, honestly, should have been let go a while ago.
- Code Inspection: Just keep an eye out for
deferstatements hiding insideforloops that look like they're going to iterate a lot. That's your big clue.
Solution:
The best way to fix this? Either move that defer into a smaller helper function that gets called in each loop iteration, or just rethink how you've structured that loop.
- Helper Functions for
defer: This is my go-to. Wrap the part of your loop that needs thedeferinto its own little helper function. Then, thedeferapplies just to that small helper, meaning resources get released after each iteration, not just at the very end of the big outer function. Much cleaner!
package main
import (
"fmt"
"os"
"log"
)
// This little function processes one file and ensures it's closed right away.
// Super important for not leaking file handles!
func processSingleFile(filename string) error {
file, err := os.Open(filename)
if err != nil {
return fmt.Errorf("uh oh, couldn't open file %s: %w", filename, err)
}
defer file.Close() // ✨ See? Defer applies to this small function, instant release!
// Just simulating some work with the file
_, err = file.Stat()
if err != nil {
    return fmt.Errorf("couldn't get info about file %s, bummer: %w", filename, err)
}
return nil
}
func main() {
// Let's make 100 dummy files for our example. Get ready!
for i := 0; i < 100; i++ {
f, _ := os.Create(fmt.Sprintf("dummy_file_%d.txt", i))
f.WriteString(fmt.Sprintf("Content for file %d. Hello Go devs!", i))
f.Close() // Yep, close these right after creating them too! Good practice.
}
fmt.Println("Processing files with defer safely tucked away in a helper function...")
for i := 0; i < 100; i++ {
    filename := fmt.Sprintf("dummy_file_%d.txt", i)
    if err := processSingleFile(filename); err != nil {
        log.Printf("Yikes, error processing %s: %v", filename, err)
    }
}
fmt.Println("All files processed! No memory spikes here, folks.")

// Don't forget to clean up those dummy files!
for i := 0; i < 100; i++ {
    os.Remove(fmt.Sprintf("dummy_file_%d.txt", i))
}
}
The Takeaway: Your Role in Go’s Memory Management 💡
Okay, so what have we learned? While Go’s garbage collector — especially that fancy Green Tea GC that landed as the default in Go 1.26 — is seriously powerful, it’s not some magic wand that makes all your memory worries vanish. Not quite. Memory leaks in Go aren’t usually about, like, needing to manually “free” memory. Instead, they’re almost always about managing references. Think about it: whether it’s a goroutine just stuck forever, a map that keeps growing with no end in sight, an HTTP response you forgot to close, or even a defer statement causing a backlog in a loop, the real problem is always some reachable reference that's telling the GC, "Nope, you can't touch this!"
But hey, you’re now armed with some serious knowledge! By understanding these common little traps — goroutine leaks, those ever-expanding data structures, forgotten resources, and the tricky defer-in-loop situation - you're already way ahead of the game. And with tools like pprof (that experimental goroutineleak profile in Go 1.26? Chef's kiss! 🤌) and a good, disciplined approach to how you handle resources and concurrency, you can totally build Go applications that are not just screaming fast and scalable, but also super tough against these silent killers. It's all about coding with an eye on the bigger picture, making sure that when something isn't needed anymore, it's truly unreachable. Happy coding, everyone, and may your memory graphs be as flat as a pancake! 🚀